 Translate
 Translate

The following topic links address:
The Colorado Department of Public Health and Environment's Air Pollution Control Division uses two reporting systems to inform the public about air quality conditions - the AQI and VSI reporting systems.
The AQI system, using the Air Quality Index, reports levels of carbon monoxide (CO), ozone (O3), particulate matter smaller than 10 microns (PM10), particulate matter smaller than 2.5 microns (PM2.5), nitrogen dioxide (NO2), and sulfur dioxide (SO2).
The VSI system, using the Visibility Standard Index, reports visibility conditions.
The AQI reporting system provides a simple, uniform way to report daily levels of air pollution.
Year round, the Division's continuous monitoring system provides hourly levels of carbon monoxide, ozone, PM10, PM2.5, NO2, and SO2. These pollutants can harm human health. A National Ambient Air Quality Standard defines the maximum levels each pollutant can reach before unhealthy conditions exist.
After analyzing current data, Division staff convert the information about the individual pollutant concentrations into numbers on a scale - the AQI scale. The National Ambient Air Quality Standard for each pollutant equals 101 on the AQI scale. AQI reports greater than 100 generally indicate exceedances of a pollutant's standard. The higher the AQI reading, the worse the air quality.
The AQI scale is described by six air quality categories. These are good, moderate, unhealthy for sensitive groups, unhealthy, very unhealthy, and hazardous.
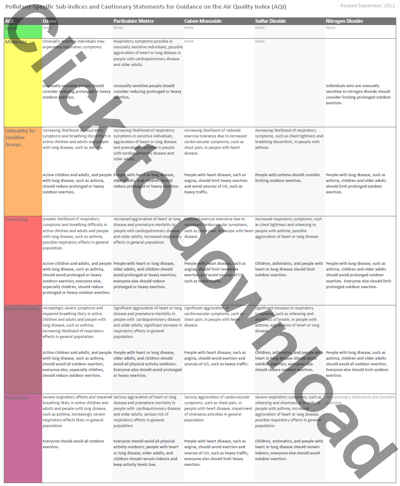
Download AQI Health Statements
According to the index, any reading between 0-50 indicates good air quality, 51-100 moderate air quality, 101-150 unhealthy for sensitive groups, 151-200 unhealthy air quality, 201-300 very unhealthy air quality, and 301 and above hazardous air quality. A table at the end of this document lists the health effects for each AQI category by pollutant.
More about the Air Quality Index
The Air Pollution Control Division utilizes a network of gaseous and particulate monitors to provide current air quality data. Each monitor reports to a computer at the Air Pollution Control Division. Hourly pollutant levels and corresponding AQI levels are tabulated and made available to the media and public.
Since these pollutants are common in Colorado, and are potentially harmful to human health, the Air Pollution Control
Division keeps the public informed about their levels. Below is a description
of the health affects of these pollutants at different levels of the AQI:
For additional information on air quality and the AQI, visit:

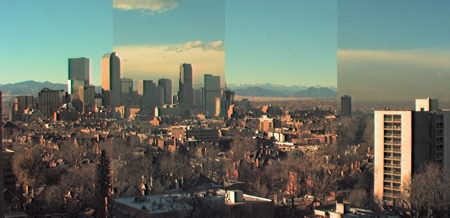
The Visibility Standard Index is a measure of the visual air quality in the Denver metro area. In other words, the Visibility Standard Index corresponds to how clear the air is.
Air Pollution Control staff at the Department of Public Health and Environment use an instrument called a transmissometer to measure the clarity of the air. The instrument measures the amount of light that is able to pass through the atmosphere. The more light that is allowed to pass, the clearer the air.
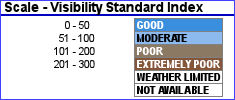
Data from the transmissometer are converted to a Visibility Standard Index based on a scale much like the AQI scale.

The standard for visual air quality is 0.076 per kilometer of atmospheric extinction, which means that 7.6 percent of a light source's intensity is extinguished over a 1-kilometer path. A violation occurs when the four-hour average extinction exceeds the 0.076 standard. The standard is in effect during the core daylight hours from 8 a.m. to 4 p.m., although extinction is monitored 24 hours a day.
The Denver metro transmissometer instrument is housed atop a building near Cheesman Park. The device, a special telescope and sensor, is aimed at a light source of known brightness atop the Federal Building, one and one-half miles away.
The transmissometer measures the intensity of the light source and then relays the data to a computer that compares the measured intensity against the light's actual intensity. The difference represents how much light the atmosphere is absorbing or scattering. This difference is converted to a number on the VSI scale. Higher VSI values are associated with higher atmospheric extinction, hazier skies, and less clear the air.
Once this information is converted into numbers on the VSI scale, it is made available to the public.
Determining the actual VSI reading for a particular day can often be complicated by the presence of precipitation, relative humidity of 70 percent or greater, and the obscuring phenomena of fog. When such phenomena are present in the atmosphere, the VSI readings are excluded because they are non representative of the visual air quality problem.
While some haze-forming pollutants such as particulate matter are directly emitted to the air, other particles such as sulfate and nitrate are created from gases emitted to the air. These particles will either scatter or absorb light, impacting a person's view of an object. Particles of sulfate, nitrate, elemental carbon and organic carbon are the most effective at scattering and/or absorbing light, geologic dust also plays a role in decreasing visibility in Colorado.
Air pollutants come from a variety of natural and manmade sources. Natural sources can include windblown dust and soot from wildfires. Manmade sources can include motor vehicles, electric utility and industrial fuel burning, and manufacturing operations. Particulate matter pollution is the major cause of reduced visibility (haze) in parts of the United States.